
NetExplorer help
NetExplorer shows what signal a customer location can expect from your network. Browse your sites and sectors, see predicted coverage on the map, check an address down to the corners of its building, and test a link between two points.
Beta. NetExplorer is in beta, so screens and wording may change as we improve it.
The screen
- Header. The Expera logo opens the company website. On the right are Help (this page, opened in a new tab), your email, My account and Sign out.
- Sidebar. Four tabs: Sites, Structures, Profile and Settings. Drag the right edge of the sidebar to make it wider.
- Map. The layer menu is at the top left, and address search and zoom are at the top right.
Quick start: check a customer address
- Open the Structures tab.
- Choose the location in either of two ways. Click Pick Address and then click the customer's location on the map, or use the address search (the magnifier at the top right of the map). Both do the same thing, and the address search also places a search pin on the map.
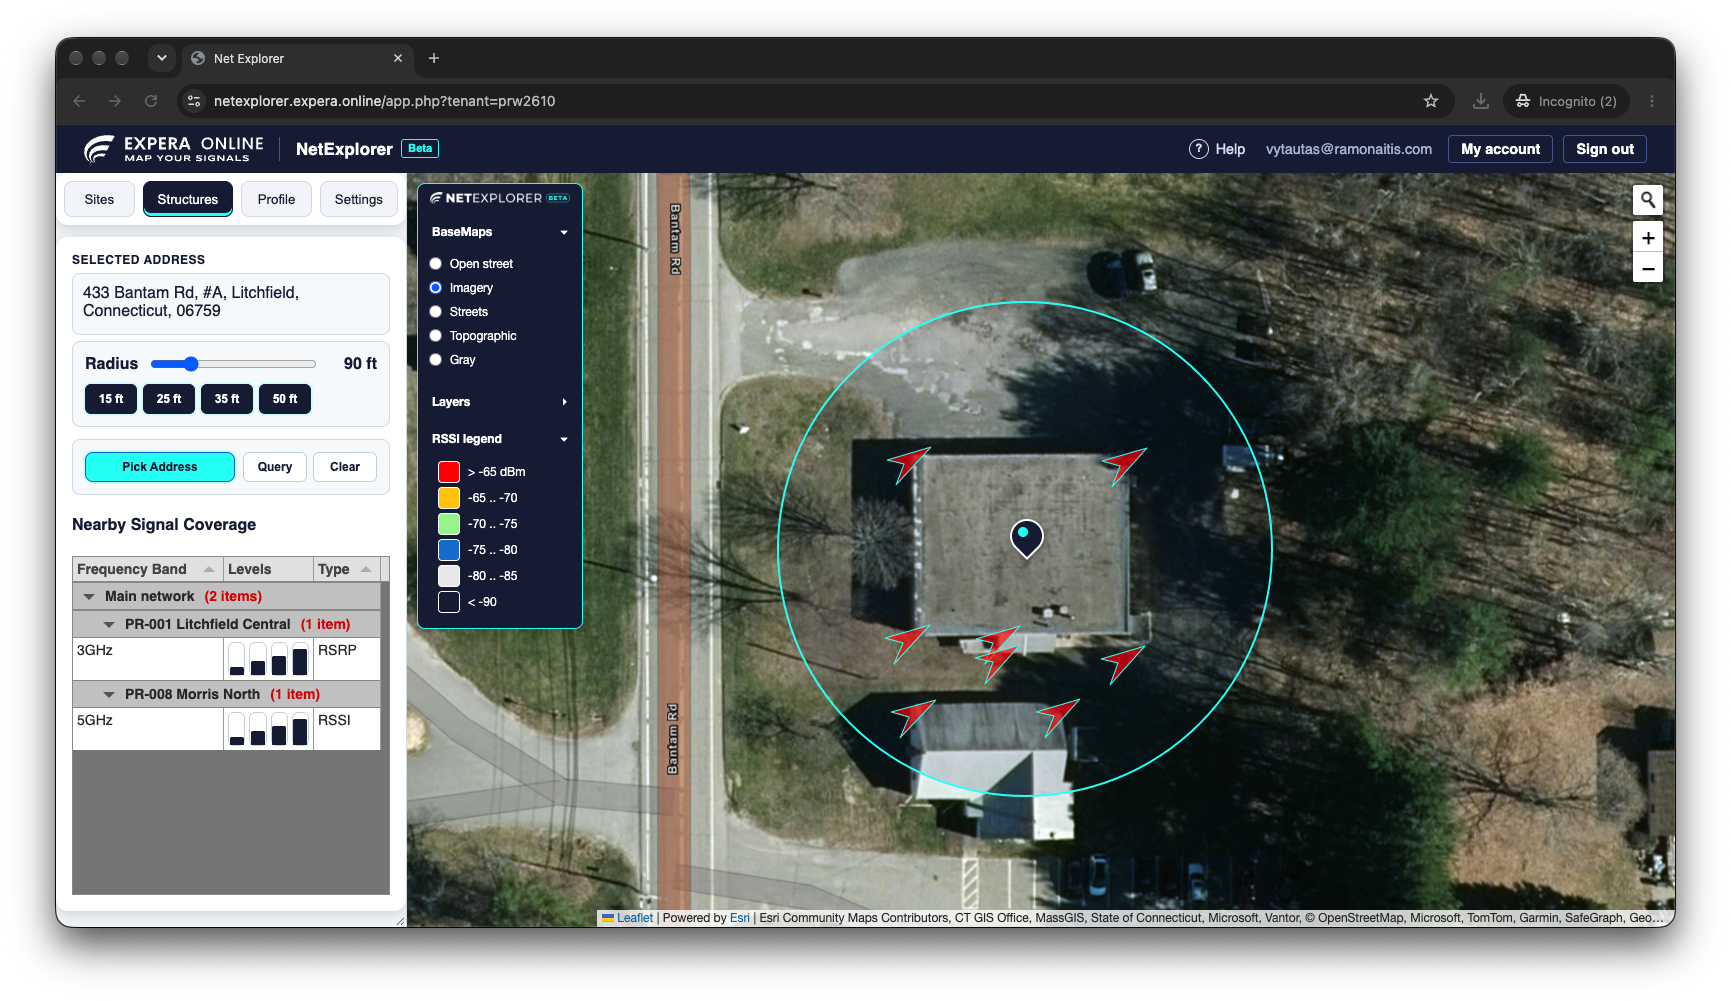
- The address appears under Selected address, a circle shows the search radius, and the results appear below.
- Read Nearby Signal Coverage for the stations that reach the location, and look at the arrows on the map for the best places to mount an antenna.
- Click a signal value in the table to see a path profile from the address, at that CPE height, to that station.
- Click Clear when you are done.
The sections below explain each part in detail.
Map and layer menu
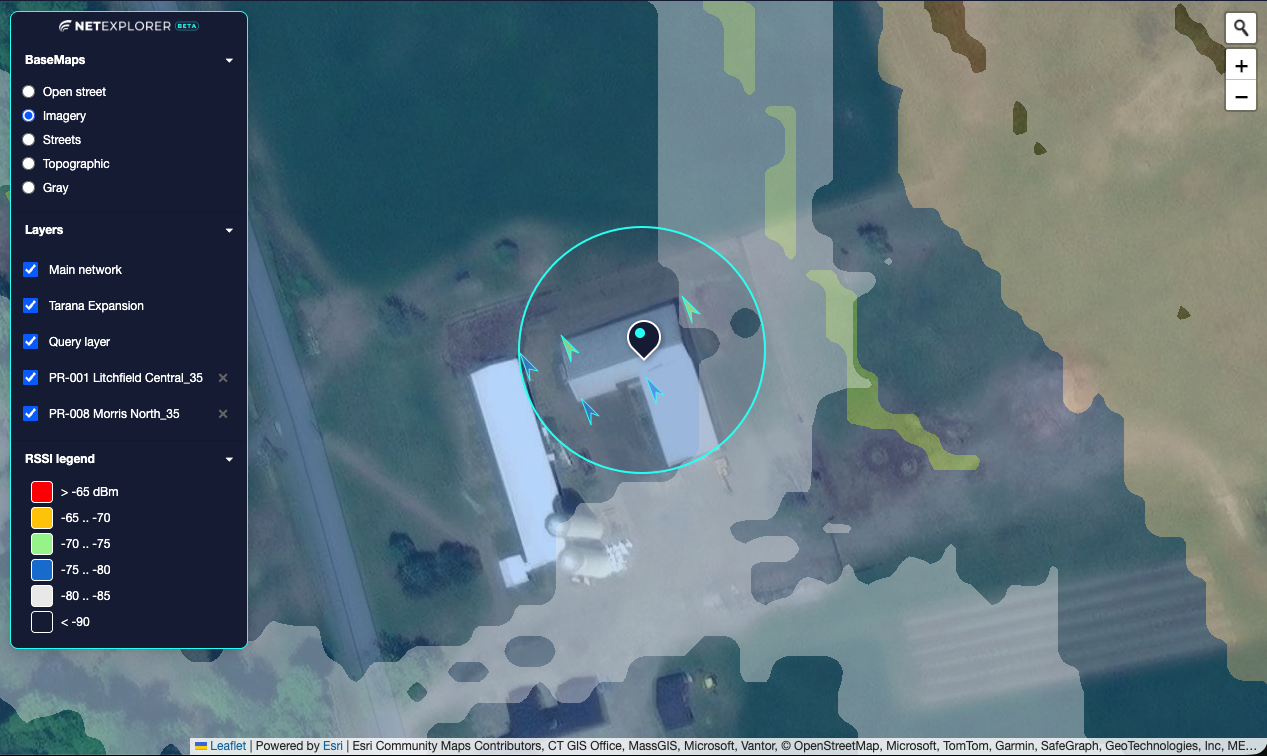
The menu at the top left of the map has three parts. Click the NetExplorer logo at the top of the menu to collapse or expand it.
| Menu item | What it does |
|---|---|
| BaseMaps | Changes the background map, for example to OpenStreetMap. |
| Layers | Lists the coverage heatmaps you have turned on. Use the checkbox to show or hide a heatmap and the ✕ to remove it. |
| RSSI legend | Shows the color scale used for signal strength. You can change the colors in Settings. |
Use the address search (the magnifier at the top right) to find an address. The map moves there and a search pin is placed. This works the same way as Pick Address in Structures.
Sites
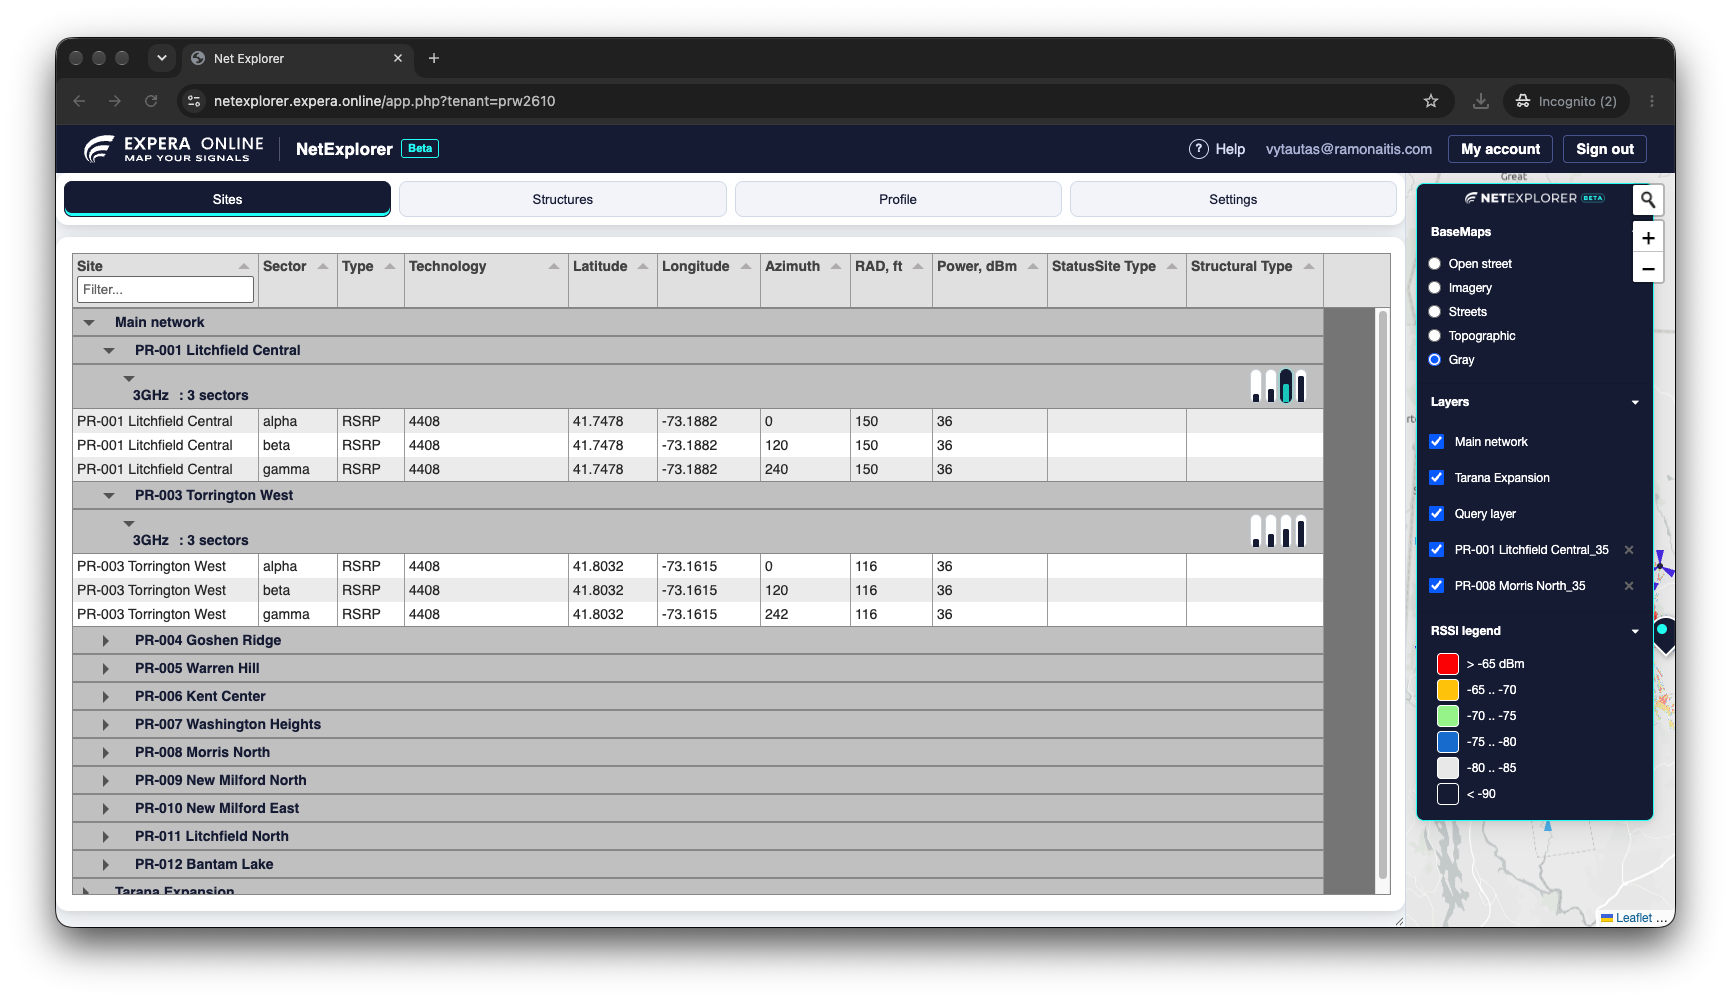
The Sites tab is your network inventory. Records are shown as a tree, and from each one you can zoom to the site and switch on its coverage.
Hierarchy
The hierarchy is configurable for your network. By default, sectors are grouped by site and then by frequency band, but it can also be, for example, sites and sectors, or status and site.
When the data comes from several sources, the top level is the source name, such as Main network, Partner A, Partner B or an expansion project.
Working with groups
- Groups start collapsed.
- Double-click a top-level group to expand all the records inside it.
- Click any other level to expand or collapse the records under it.
- Click a site or sector name to zoom the map to it.
Finding records
- The map filters the list. The inventory shows only the records that are currently on the map. Zoom or pan to an area to see just the sites in it.
- Column filters. Some columns have a filter, which is another quick way to find a record.
- More columns. Rows can also show location, azimuth, technology, power, status, channel and beamwidth. When the sidebar is narrow some columns are hidden, so drag its edge to widen it.
Coverage
The small bars in the Levels column are receiver (CPE) heights. Click a bar to show or hide the coverage heatmap at that height.
What a bar controls depends on how your calculation engine is configured. Coverage can be calculated by site, by site and frequency band, or for individual sectors, and the bars appear at that level of the hierarchy.
Structures
Use Structures to qualify an address or find the best place to mount an antenna.
Controls
| Control | What it does |
|---|---|
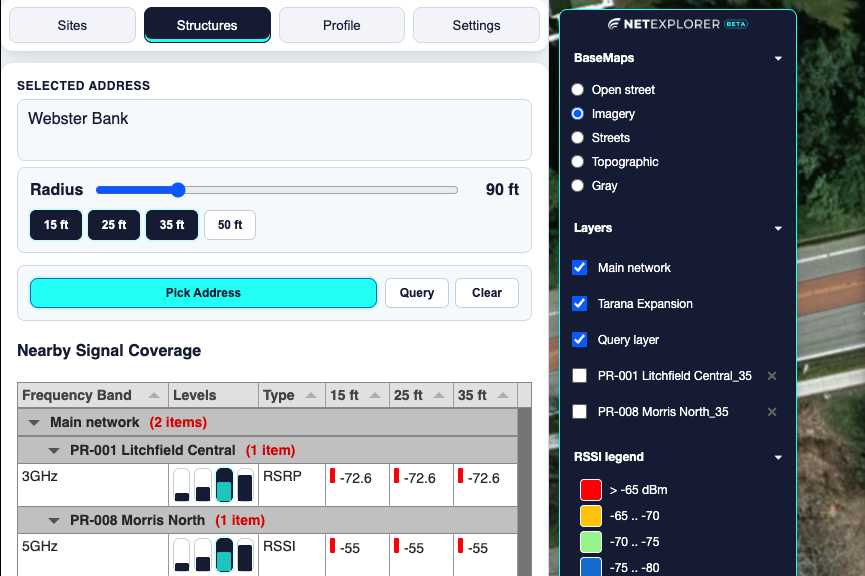
| Selected address | Shows the address of the point you picked. |
| Radius | How far around the picked point to look, from 60 to 200 ft in steps of 10 ft. Default is 90 ft. |
| Height buttons | The receiver (customer antenna) heights to evaluate. Results show one column for each height you choose. |
| Pick Address | Turns on pick mode. Click the map to choose the location. The address search on the map does the same and also places a search pin. |
| Query | Evaluates a grid of points across the whole radius. |
| Clear | Removes the results, the markers and the radius circle, and resets the path tools. |
What happens when you pick an address
- NetExplorer finds the address of the point you picked, or the point of the address you searched for.
- It lists the nearby sites (within about 10 miles) that reach the point.
- If there are buildings inside the radius, it evaluates the signal at the building corners, not just at one point. The 10 strongest locations are marked on the map with arrows that point toward the best serving site.
Locations are ranked by strongest signal first. If two are equal, the one closer to the point you picked ranks higher. Each arrow has a popup with up to 5 of the best serving stations at that location, with their signal values at the selected CPE heights.
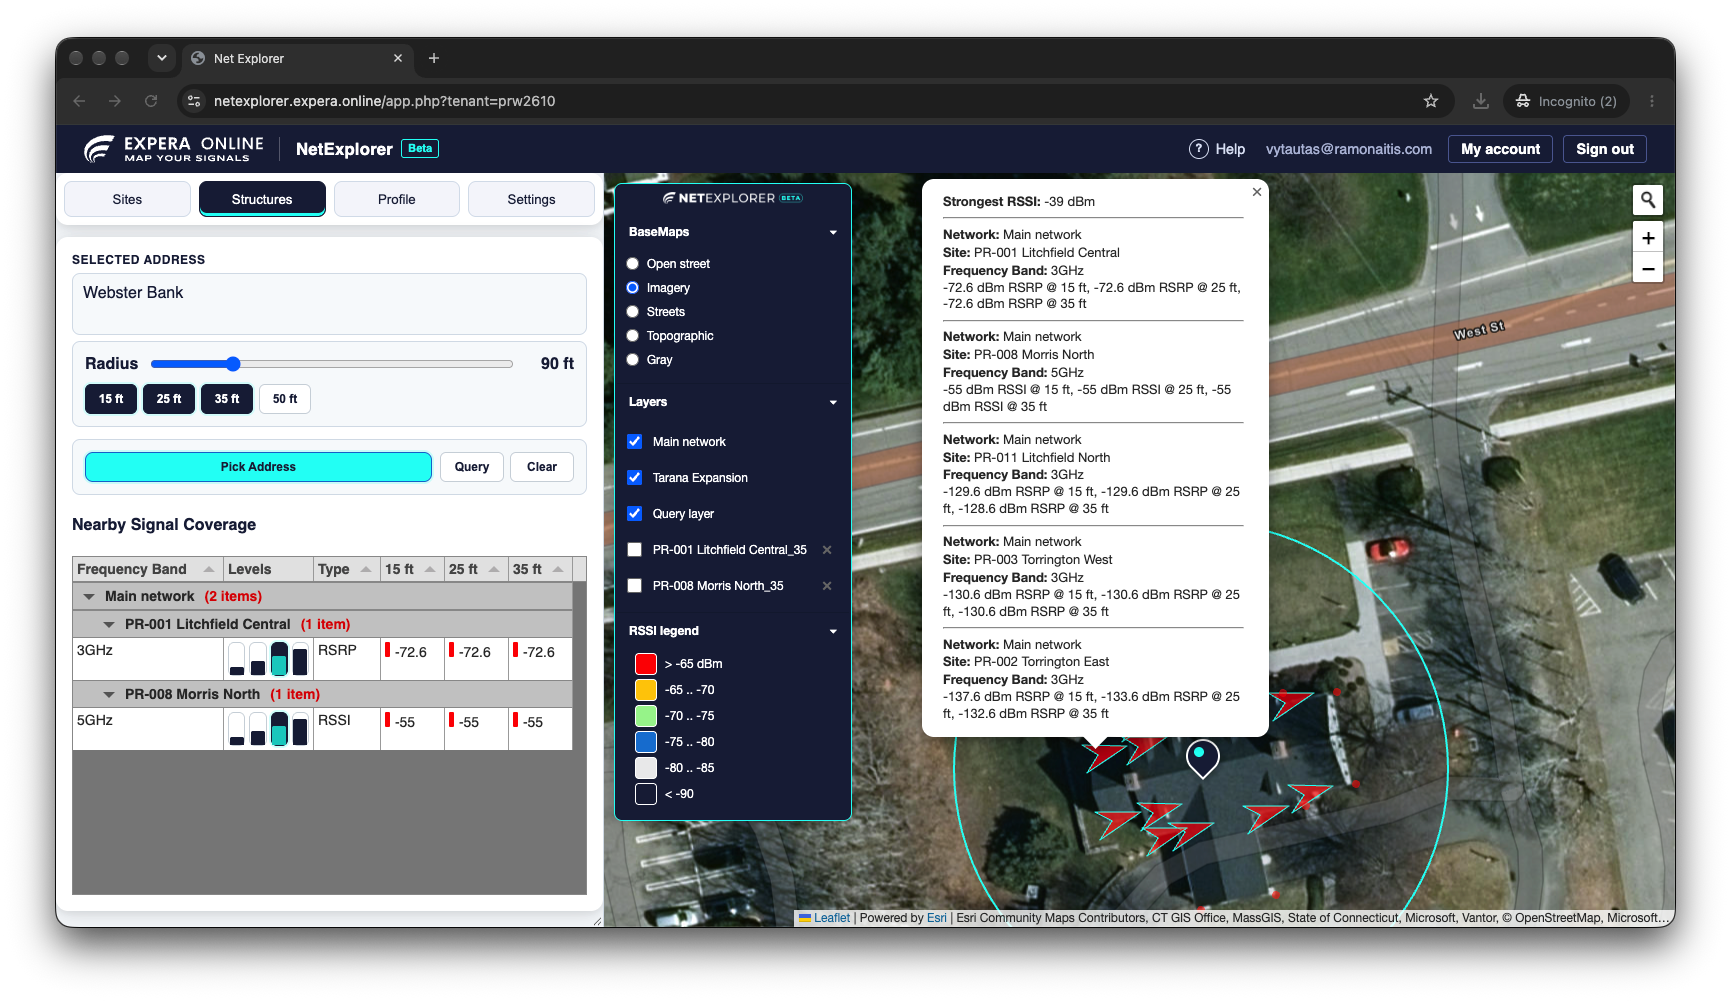
Tip. Adjacent sides of a building can see very different signal. Check the corner markers before a site visit to choose the best installation side.
Query: when there is no building
If no building is found, or you are checking a lot or a field, click Query. It evaluates a grid of points every 10 ft inside the radius and ranks them the same way.
Nearby Signal Coverage
The table below the controls lists the sectors that reach the picked point, grouped by network, site and sector.
- Frequency Band, Levels and Type (RSSI or RSRP).
- One column per receiver height, with the signal in dBm and a colored marker from the legend.
- Only sectors with at least one signal above your Min. RSSI setting are listed.
Click a signal value to automatically create a path profile from the address, at the selected CPE height, to the selected station. Click the level bars to show that station's coverage heatmap.
Path profile
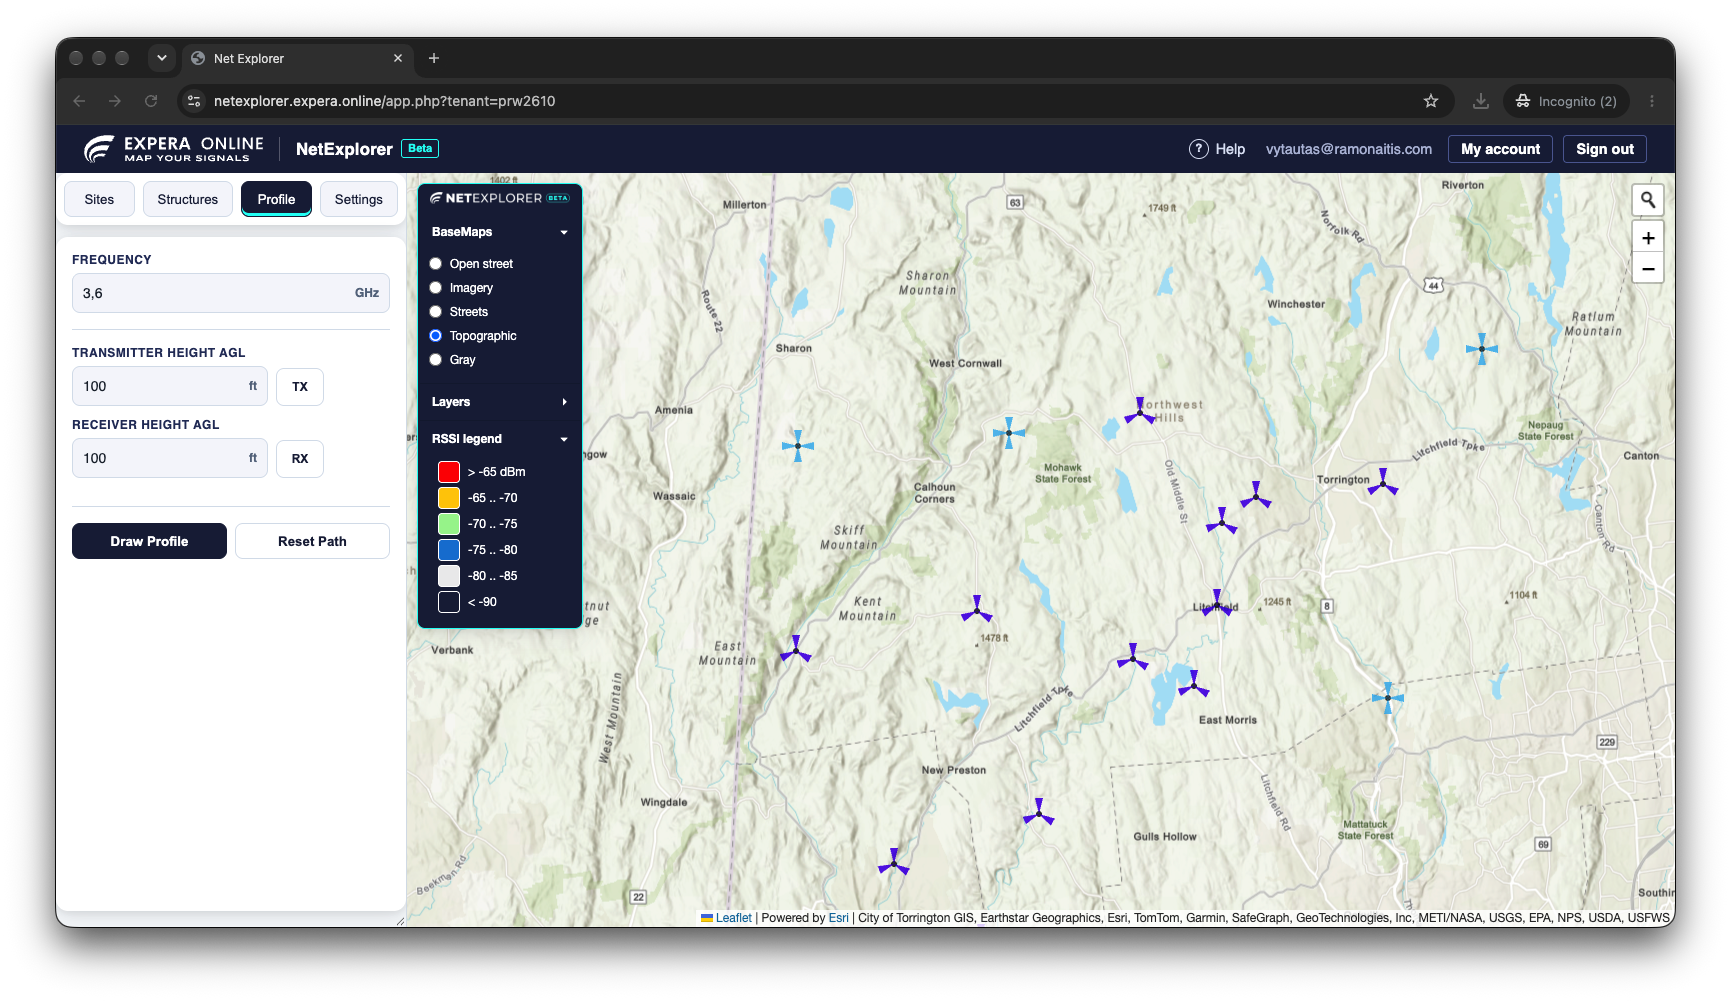
The Profile tab draws a terrain profile between two points, so you can check line of sight and the Fresnel zone for a link.
- Set the Frequency in GHz (default 3.6).
- Click TX, then click the transmitter on the map. If you click close to a site, the point snaps to it and fills in the site's height. Otherwise your click is used as is.
- Click RX and click the receiver the same way.
- Adjust Transmitter Height AGL and Receiver Height AGL if needed. Heights are above ground level.
- Click Draw Profile. The profile chart opens on the map.
Click Reset Path to clear the path and start again.
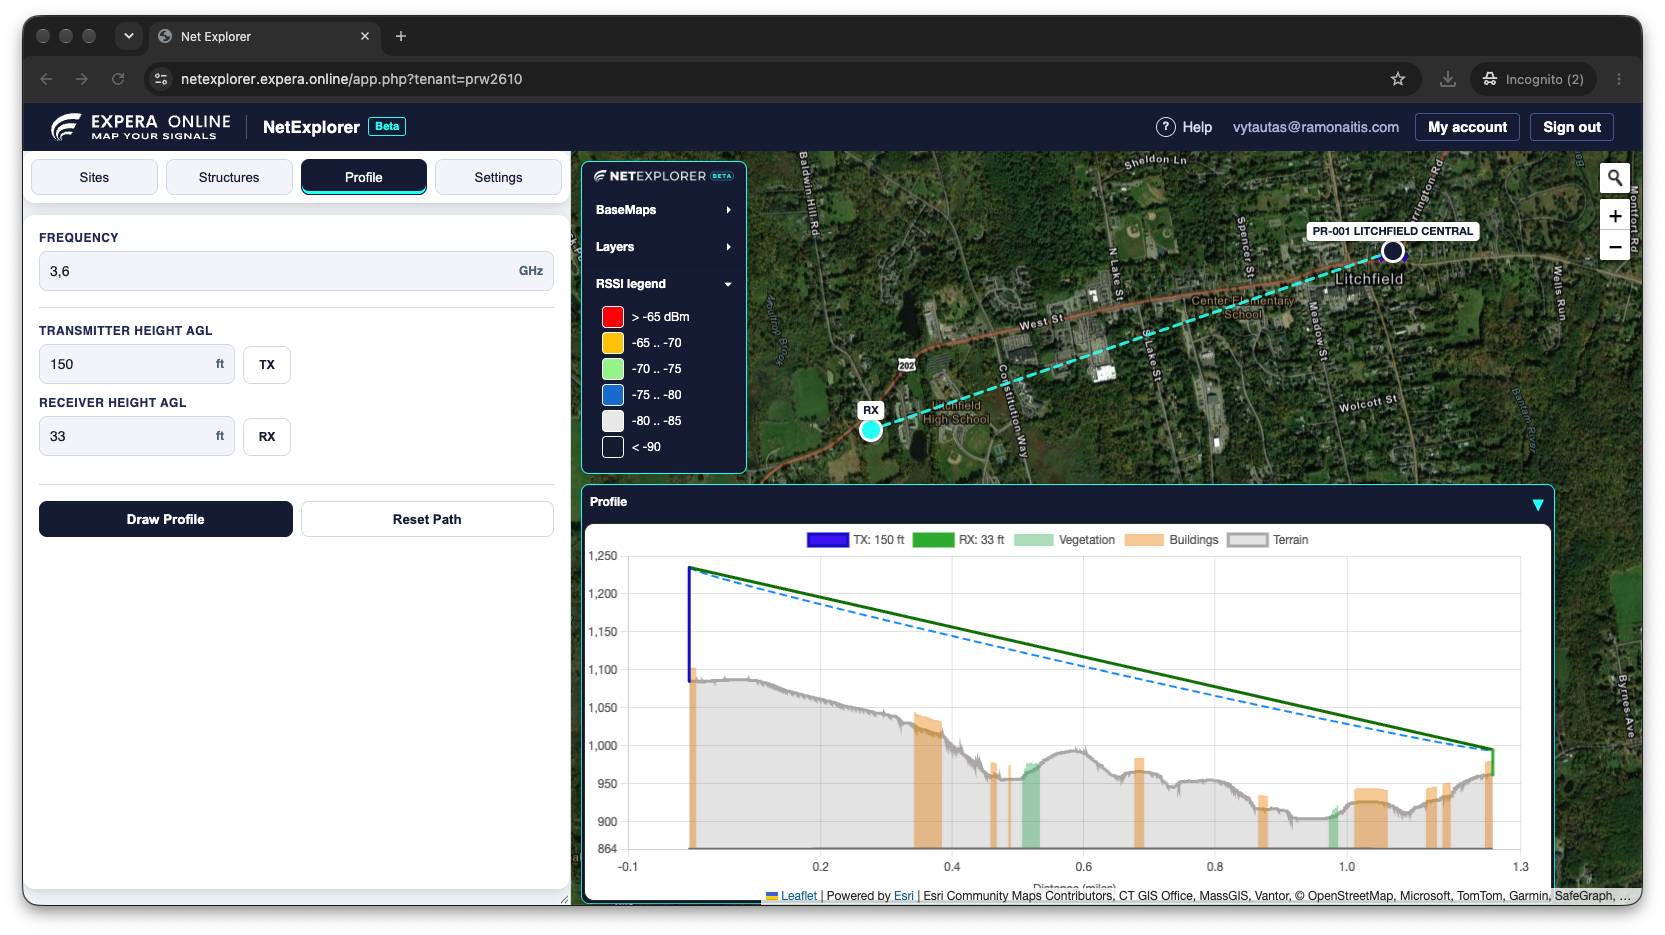
Shortcut. In Structures, clicking a signal value in Nearby Signal Coverage creates the path profile automatically, from the address at the selected CPE height to the selected station.
Settings
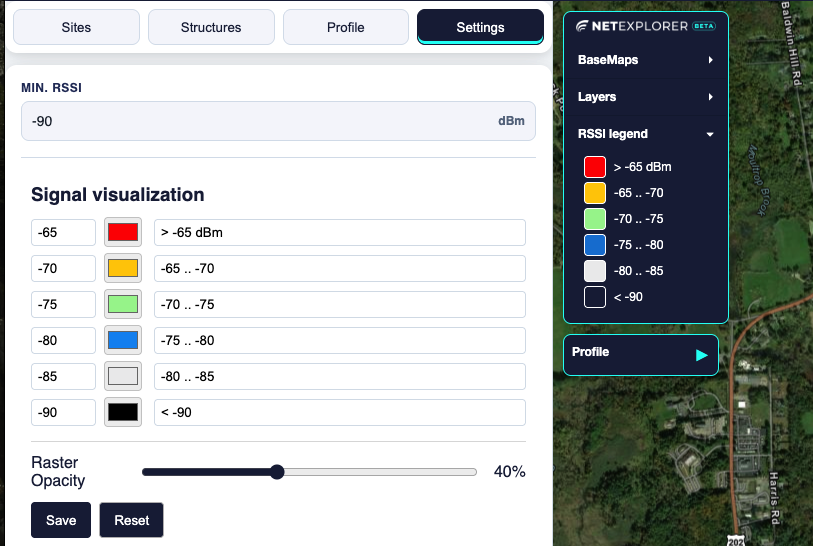
Min. RSSI
Signals weaker than this value (in dBm) are ignored when listing and ranking results. The default is −90 dBm, and you can set it between −120 and −20. Lower it to see weaker sectors, or raise it to see only strong ones.
Signal visualization
Defines the signal levels and colors used for the heatmaps and the legend. Change a level or color and click Save to apply it, or Reset to go back to the defaults. A slider also controls how transparent the heatmaps are.
Understanding signal values
- dBm. Signal levels are negative numbers, and the closer to zero, the stronger. For example, −67 dBm is much stronger than −89 dBm.
- RSSI and RSRP. The Type column shows which one a sector reports. Compare values of the same type.
- Receiver height. This is the height of the customer's antenna above the ground. A higher antenna often sees a better signal, so compare heights before deciding on a mount.
- Units. Heights are shown in feet or meters according to your account's setting.
Predictions are based on terrain, buildings and vegetation, but they are still predictions. Use them to choose where to look first and to reduce surprises on site.
Troubleshooting
No results after picking an address
No sector may be above your Min. RSSI setting. Lower it in Settings and pick the address again. The point may also be outside your coverage area.
No arrows at the building corners
Most likely the building is not in the database yet. To check, switch the basemap to OpenStreetMap in the BaseMaps menu and see whether the building is shown there. If it is missing, click Query to evaluate the whole radius instead.
The address says "Address not found"
The location can't be matched to an address, for example in a field. The signal is still evaluated for the point you clicked.
A heatmap does not appear
Heatmaps load when you turn them on, so give them a moment. Check that the heatmap is checked in the Layers menu. If the coverage service is temporarily unavailable, try again later.
Some columns are missing in Sites
The sidebar is too narrow. Drag its right edge to widen it.
Your account
- Sign in with your email and password, or choose Sign in with ArcGIS Online.
- Forgot your password? Use the link on the sign-in page. We email you a link that is valid for one hour.
- Change your password from My account in the header.
- Sign out from the header when you are done, especially on a shared computer.
For anything else, contact your administrator or your Expera representative.
Glossary
- AGL
- Above ground level. How high an antenna is above the ground beneath it.
- CPE
- Customer premises equipment, the customer's antenna and radio.
- Fresnel zone
- The oval-shaped area around the straight line between two antennas that should stay mostly clear of obstructions for a good link.
- Heatmap
- A colored overlay showing predicted signal strength across the map.
- Line of sight
- A clear straight path between two antennas.
- RSRP
- Reference signal received power, a signal measure used for LTE-type sectors.
- RSSI
- Received signal strength indicator, the total signal level at the receiver.
- Sector
- One antenna coverage area at a site, usually pointing in a single direction (azimuth).
- Site
- A tower or other location that hosts one or more sectors.